SP500 LDN TRADING UPDATE 27/2/26

SP500 LDN TRADING UPDATE 27/2/26
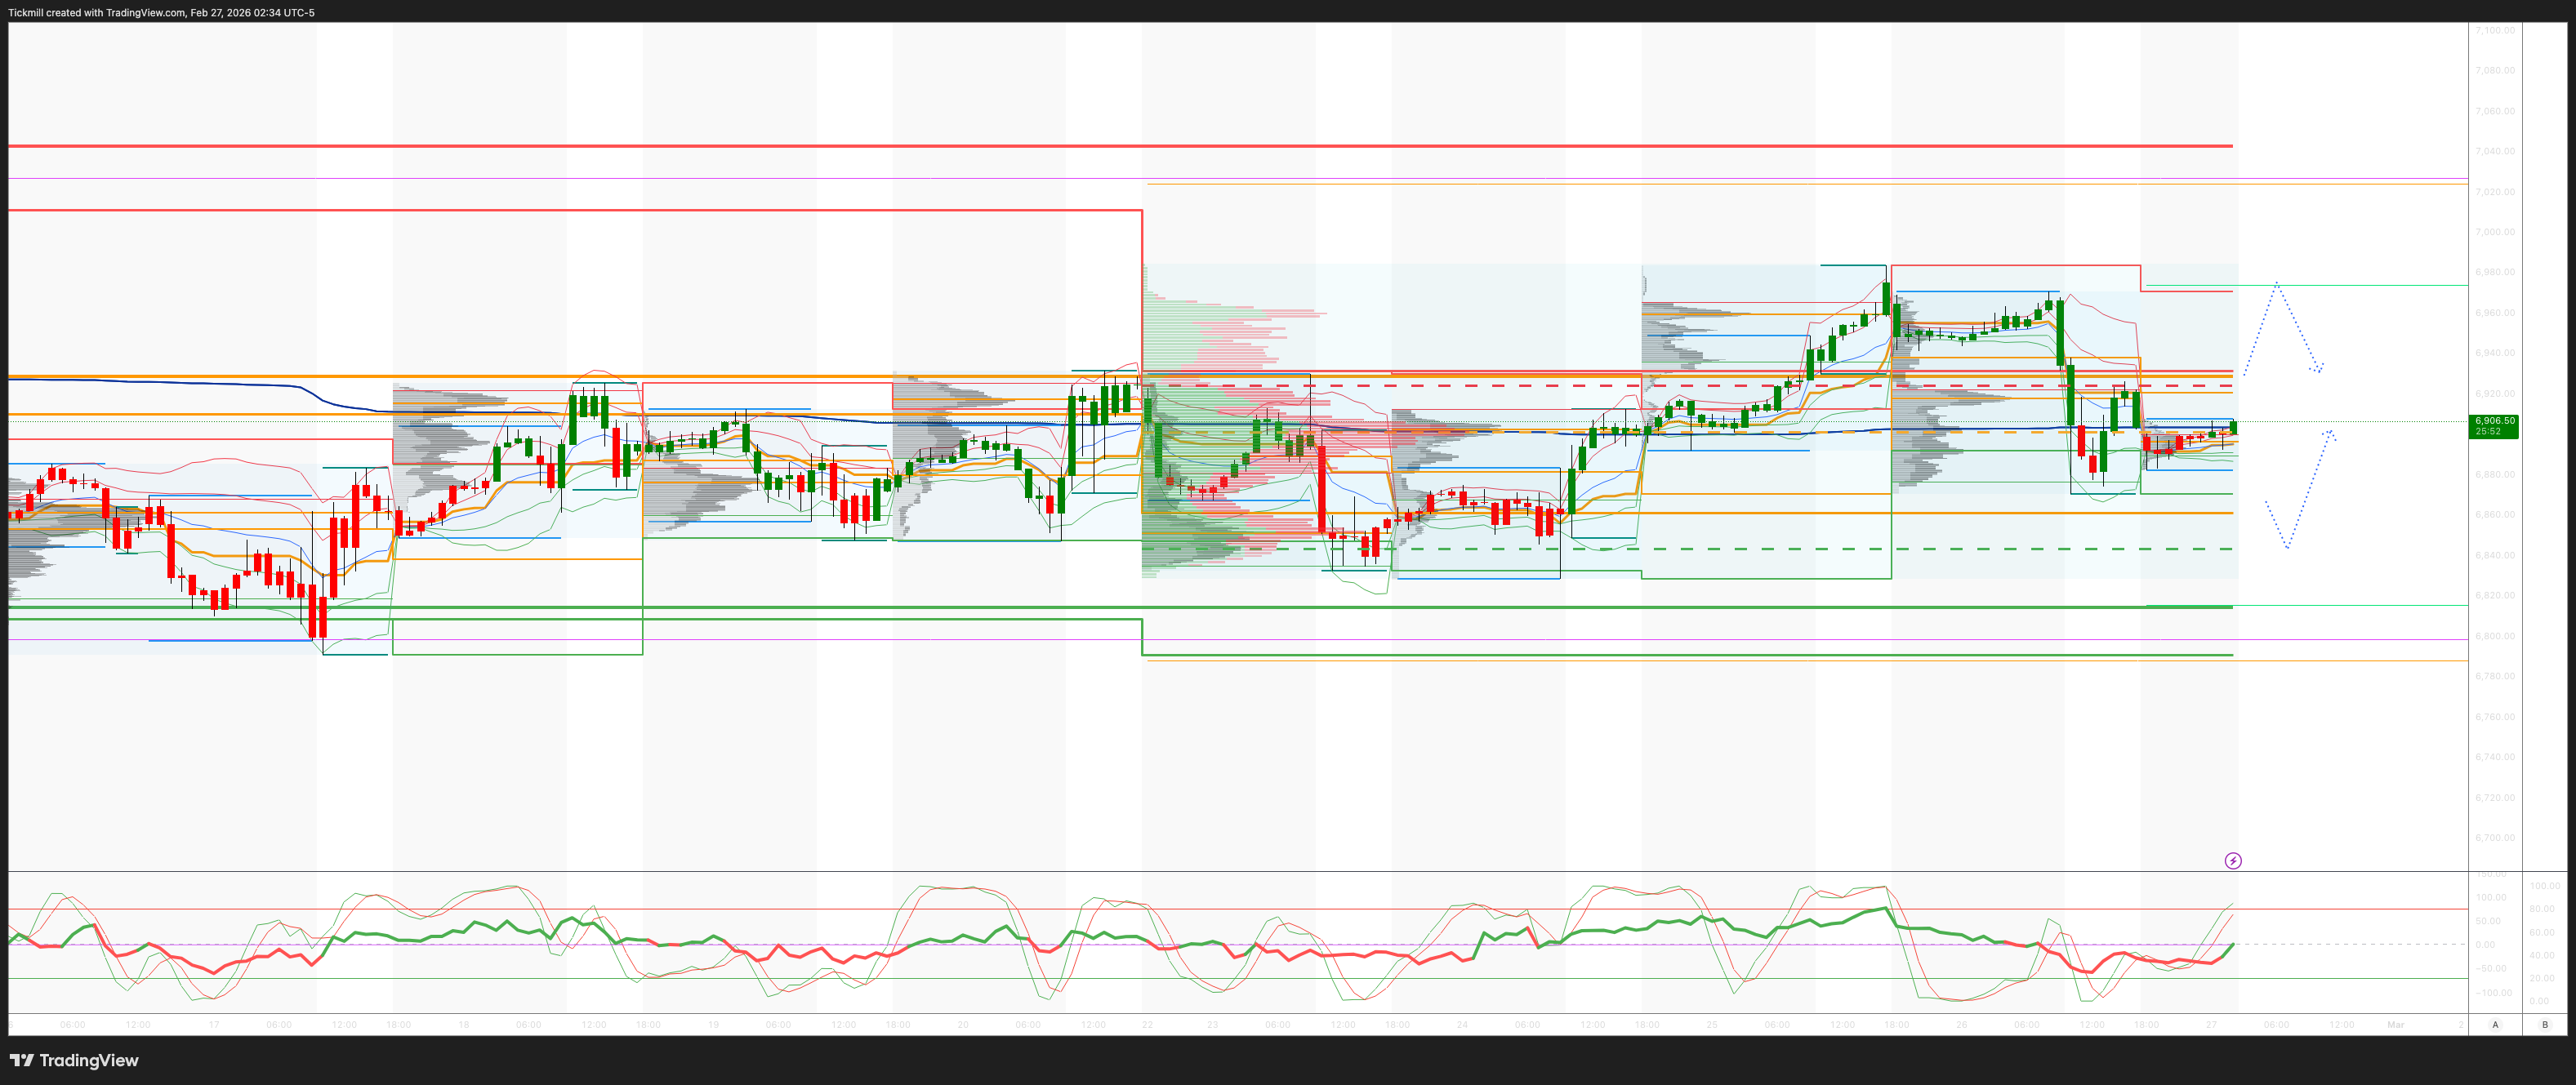
WEEKLY & DAILY LEVELS
***QUOTING ES1! FOR CASH US500 EQUIVALENT LEVELS, SUBTRACT POINT DIFFERENCE***
WEEKLY BULL BEAR ZONE 6925/15
WEEKLY RANGE RES 7046 SUP 6906
FEB EOM Straddle indicates a range of 214.6 points, suggesting a monthly FEB range of [6725, 7154]
MAR QOPEX Straddle offers a range of 368.55 points, resulting in a range of [6466, 7203].
The range from DEC2025 OPEX to DEC2026 OPEX is 945 points, providing a range of [5889, 7779].
DAILY VWAP BEARISH 6896
WEEKLY VWAP BEARISH 6928
MONTHLY VWAP BULLISH 6865
DAILY STRUCTURE – BALANCE 6992
WEEKLY STRUCTURE – BALANCE 7031/6801
MONTHLY STRUCTURE – TBC
DAILY RANGE RES 6970 SUP 6837
GAMMA FLIP 6945
TRADES & TARGETS
LONG ON RECLAIM WEEKLY BULL BEAR ZONE TARGET DAILY RANGE RES
LONG ON REJECT/RECLAIM OF DAILY RANGE SUP TARGET WEEKLY BULL BEAR ZONE
(I FADE TESTS OF 2 SIGMA LEVELS ESPECIALLY INTO THE FINAL HOUR OF THE NY CASH SESSION AS 90% OF THE TIME WHEN TESTED THE MARKET WILL CLOSE ABOVE OR BELOW THESE LEVELS)
GOLDMAN SACHS TRADING DESK VIEW - ‘Unwind’
S&P closed down 54bps at 6,909 with a Market-on-Close (MOC) of $1.5bn to buy. NDX dropped 116bps to 25,034, while R2K rose 52bps to 2,677, and the Dow edged up 3bps to 49,499. A total of 19.59 billion shares traded across all U.S. equity exchanges, slightly above the year-to-date daily average of 19.26 billion shares. The VIX climbed 402bps to 18.65, WTI Crude increased 18bps to $65.54, the U.S. 10-year yield fell 4bps to 4.01%, gold rose 64bps to 5,197, the DXY gained 6bps to 97.76, and Bitcoin dropped 229bps to $67,379.
The day saw a momentum unwind in TMT, with the GS AI Pair experiencing its worst performance since DeepSeek, while Software outperformed with a strong +3 bid. AI software versus semiconductors had its best performance day in over a year. The session appeared to reflect one-sided positioning ahead of an earnings week, with some stocks showing resilience despite bad news (e.g., HPQ, WDAY, CRM) or failing to rally on good news (e.g., NVDA, which fell 5.5%). Weakness in NVDA was attributed to: 1) the stock being heavily bid and well-owned prior to earnings (+3% Monday through Wednesday); 2) lingering concerns about 2027 numbers, including peak capex from hyperscalers and peak earnings; and 3) upcoming catalysts (conference next week and NVDA GTC) prompting some buyers to hold off. Despite strong buying interest in NVDA leading up to earnings, there was minimal follow-through, and the broader semiconductor sector saw supply pressure.
Callahan on NVDA: This was a pivotal quarter with revenue guidance in the mid-teens q/q, yet the stock continues to de-rate (~15x GIR’s $12.65 EPS estimate for 2027). NVDA remains one of the few TMT names not indicative of sustained AI momentum into 2027+. Other AI-related components and end markets suggest outsized growth into that period, which could support the bull case given the upcoming catalyst path.
Overall activity levels were subdued, rated a 4 on a 1-10 scale. Our floor ended down 108bps for sale versus a 30-day average of -18bps. Desk activity was light, reflecting reduced top-down trading and degrossing. Hedge funds (HFs) were caught offside by the day’s moves. Asset managers were small net sellers (-$650m), driven by supply in macro products and tech, offset by demand in materials and communication services. Hedge funds were net sellers of $2 billion, with supply concentrated in macro products and scattered covering in software and discretionary. Long exposure in U.S. Software & Services stocks has dropped to its lowest recorded level. The aggregate long/short ratio in the sector now stands at 1.14, compared to 1.82 at the start of 2026 and a historical peak of 4.74.
Derivatives: The session started with a significant selloff, led by NVDA realizing its implied downside move. Market sentiment suggests the activity was driven by degrossing rather than broader systemic issues. The macro backdrop appears strong enough to prevent a major SPX downturn, although risks remain. SMH fixed strike volatility declined, indicating degrossing rather than semis-specific selling pressure. S&P fixed strike volatility was flat, with no major outperformance in the VIX complex. Skew was bid across the curve, and flows showed term structure buying and index hedges extended out 2-3 months. The implied move through the end of the week closed at approximately 65bps. (H/T Shayna Peart)
Disclaimer: The material provided is for information purposes only and should not be considered as investment advice. The views, information, or opinions expressed in the text belong solely to the author, and not to the author’s employer, organization, committee or other group or individual or company.
Past performance is not indicative of future results.
High Risk Warning: CFDs are complex instruments and come with a high risk of losing money rapidly due to leverage. 71% and 74% of retail investor accounts lose money when trading CFDs with Tickmill UK Ltd and Tickmill Europe Ltd respectively. You should consider whether you understand how CFDs work and whether you can afford to take the high risk of losing your money.
Futures and Options: Trading futures and options on margin carries a high degree of risk and may result in losses exceeding your initial investment. These products are not suitable for all investors. Ensure you fully understand the risks and take appropriate care to manage your risk.
Patrick has been involved in the financial markets for well over a decade as a self-educated professional trader and money manager. Flitting between the roles of market commentator, analyst and mentor, Patrick has improved the technical skills and psychological stance of literally hundreds of traders – coaching them to become savvy market operators!