Institutional Insights: BofA 'The Flow Show' 15/5/26

# BofA Flow Show: Melt-Up Is Becoming Consensus, but Inflation and Bonds Are the Endgame
The market mood has shifted from cautious recovery to outright melt-up. YTD leadership is dominated by real assets and risk: oil +76.6%, commodities +62.5%, ACWI +12.3%, SPX +9.5%, gold +7.9%, while bitcoin -7.1% is the laggard. The central tension is clear: stocks and commodities are being bid as investors assume no Fed hikes, even as inflation is accelerating and bond yields are breaking higher.
The headline message from BofA: wealth-driven US boom loop remains intact, but it is now vulnerable to politics and bonds.
## Scores on the doors: real assets dominate
YTD returns:
| Asset | YTD |
|---|---:|
| Oil | +76.6% |
| Commodities | +62.5% |
| ACWI | +12.3% |
| S&P 500 | +9.5% |
| Gold | +7.9% |
| Cash | +1.3% |
| HY | +1.3% |
| USD | +0.5% |
| IG | 0.0% |
| Government bonds | -0.9% |
| Bitcoin | -7.1% |
The leadership mix is late-cycle/inflationary: oil, commodities, equities, and gold are working, while government bonds and crypto are not. That is not a classic disinflationary risk-on tape. It is an inflationary asset-price melt-up.
## Biggest picture: the US boom loop is still alive
US household equity wealth is up roughly USD 4tn YTD, based on BofA private client equity holdings data. That follows massive prior gains:
- 2025: +USD 10tn
- 2024: +USD 9tn
- 2023: +USD 8tn
- 2026 YTD: +USD 4tn
This matters because wealth is central to the US “boom loop.” Rising stock prices boost household net worth, support spending, validate earnings expectations, and attract more inflows into equities. That feedback loop can keep working longer than macro bears expect.
But BofA’s warning is that the boom loop usually ends through politics and bonds. In other words, either inflation/inequality triggers political intervention, or yields rise enough to break the asset-price cycle.
## The price is right: SOX is in bubble territory
The SOX semiconductor index is now trading 62% above its 200-day moving average. BofA notes this is comparable only to extreme historical episodes such as:
- French market at the peak of the Mississippi bubble
- Nasdaq at the peak of the dot-com bubble
This does not mean semis must immediately collapse, but it does mean price action is becoming exponential. The ingredients are familiar:
- Extreme price momentum
- Heavy market concentration
- Collapsing volatility
- Stocks “bossing” bond yields higher
- Investors adopting melt-up as base case
The phrase “why melt-up is everyone’s new base case” captures the problem. Once everyone accepts the melt-up, the risk/reward of chasing becomes much less attractive.
## Tale of the tape: no Fed hikes, so investors chase stocks and commodities
US inflation is becoming the key risk. BofA argues CPI is on course for above 5% by the midterms unless the recent pace of monthly gains slows quickly. PPI is already running around 6%, while CPI is near 4%, with energy, electricity, transportation, goods prices, and rents all rising.
But investors do not expect Fed Chair Warsh to hike in 2026. That is crucial. If inflation is rising but the Fed is perceived as unwilling to hike, the market naturally shifts into a “buy real assets and equities” regime.
That explains why investors are positioning for stocks and commodities max bid into November. But it also explains why bond yields are breaking higher. If the Fed will not lean against inflation, the bond market has to do the tightening.
BofA flags that yields are up roughly 50bps in three months after the new Fed chair, with a projected setup of:
- 2Y UST: 4.53%
- 10Y UST: 4.93% by mid-August
That is the risk: equities are celebrating no hikes, but bonds are starting to price the inflation cost of no hikes.
## 4% CPI and there be dragons
BofA’s key inflation warning: once CPI crosses 4%, risk assets tend to become unstable. Over the past 100 years, once CPI crosses 4%, the S&P 500 has averaged:
- -4% over the next 3 months
- -7% over the next 6 months
This is not a timing tool, but it is a regime warning. Above 4% inflation, valuation multiples become more fragile, bond volatility rises, and central banks lose flexibility.
That is especially dangerous when equity leadership is concentrated and semiconductors are stretched.
## Weekly flows: everything still gets money except crypto and China
Weekly flows:
- Bonds: +USD 28.1bn
- Stocks: +USD 20.5bn
- Cash: +USD 5.8bn
- Gold: +USD 2.0bn
- Crypto: -USD 1.3bn
Major flow details:
- Crypto: -USD 1.3bn, biggest outflow since Feb 2026
- Treasuries: +USD 5.6bn, biggest inflow in 6 weeks
- IG bonds: +USD 14.0bn inflow
- IG bonds 4-week inflow: +USD 42.2bn, biggest since Mar 2026
- China stocks: -USD 22.2bn, biggest outflow since Jan 2026
- US large caps: +USD 24.4bn, biggest in 5 weeks
- MBS: +USD 1.2bn, biggest since Oct 2025
- Tech: +USD 5.4bn, biggest since Feb 2026
- Healthcare: +USD 0.5bn, biggest since Jan 2026
- Real estate: +USD 0.7bn, biggest since Dec 2025
- Infrastructure: +USD 1.5bn, record inflow
The flows confirm the regime: investors are still buying equities, especially US large cap and tech, while also adding to bonds and gold. That is a barbell of melt-up participation plus inflation/rate hedging.
China is the clear funding source, with a massive USD 22.2bn outflow. Crypto is also losing sponsorship despite broader risk appetite.
## Private clients: maximum equity allocation
BofA private clients now hold:
- Stocks: 65.7%, highest ever
- Bonds: 17.3%, lowest since March 2022
- Cash: 9.8%, lowest ever
This is a major sentiment and positioning warning. Private client allocation is extremely pro-equity and underweight cash. That does not automatically end the rally, but it means future marginal buying power is more limited.
Over the past four weeks, private clients bought:
- Energy ETFs
- Municipal bond ETFs
- Materials ETFs
They sold:
- Utilities ETFs
- Financials ETFs
- Tech ETFs
That suggests private clients are rotating toward inflation beneficiaries and tax-efficient income, while taking some money out of prior winners like tech. But aggregate equity exposure remains extremely high.
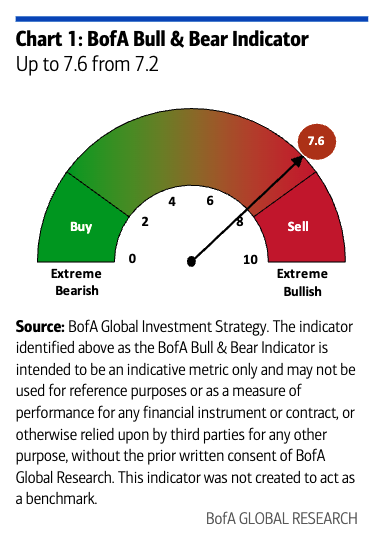
## Bull & Bear Indicator nearing sell signal
The BofA Bull & Bear Indicator rose to 7.6 from 7.2, driven by inflows into HY and EM debt. BofA says it could reach the 8.0 sell-signal level within two weeks if:
- Global Fund Manager Survey cash falls from 4.3% to 3.8%
- Global stocks see USD 15-20bn of inflows over the next two weeks
- EM debt and HY bonds see around USD 2bn of inflows
This is important because a move to 8.0 would indicate a crowded bullish consensus. The setup is not necessarily “short now,” but it argues for taking profits into strength, especially in crowded tech and commodity winners.
## Peak June: risk of bull capitulation
BofA argues “bull capitulation” into stocks and tech may be complete in the next few weeks, making early June a ripe window to take some risk off the table.
Key June events:
- June 7: OPEC meeting
- June 11: World Cup begins
- June 14: Trump’s 80th birthday
- June 15: G7 summit
- June 17: First FOMC under Warsh
This cluster matters because markets are entering it with high equity allocations, stretched semiconductor momentum, rising inflation, and bond yields near breakout levels. In that context, any hawkish bond-market repricing or political inflation pivot could cause a sharp rotation.
## Prices to know: echoes of 1989, 1999, and 2009
BofA highlights several unsettling market analogues.
Japan: Nikkei is annualizing an 86% gain, while 10Y JGB yields are on pace for a roughly 150bps rise in 2026. That echoes past late-cycle Japanese episodes such as 1989 and 2025.
US: Nasdaq and 10Y UST yields are both annualizing large gains, similar to patterns seen in 1999 and 2009. This kind of simultaneous equity/yield surge can look like early-cycle reflation or late-cycle excess. The question is whether earnings can keep up with the yield reset.
Financials: Financials relative to the S&P 500 are now below the March 2000 dot-com lows, March 2009 GFC lows, and October 2020 lows. That is a striking sign of how concentrated the market has become in tech and non-financial growth.
Tech credit: Despite strong tech EPS, hyperscalers are raising debt in cheaper jurisdictions, and tech credit is weak:
- IG tech bonds: -1.5% YTD
- HY tech bonds: -3.7% YTD
That divergence between equity euphoria and credit weakness is worth watching.
## Politics: the slow-burn risk
BofA’s political point is that the 2020s are not friendly to centrist incumbency. UK local elections showed insurgent parties — Reform and Greens — surging from 3% to 41% vote share, while established Labour and Conservative parties fell from 92% to 54%.
The broader implication: affordability and inequality are politically toxic. Trump’s inflation approval is around 30%, near Biden-era lows. If inflation stays high and asset prices keep rising, political pressure to “whip inflation” could eventually force a pivot away from chips and commodities toward consumer relief.
BofA frames this as a slow-burn risk that could drive a mass pivot from Chips and Commodities to Consumer in 2027.
## Trading implications
The market remains in melt-up mode, but positioning and inflation risks are rising.
Preferred tactical stance:
- Stay long the melt-up while price action confirms it, but reduce leverage into early June.
- Take profits in the most extended semiconductor and AI winners.
- Maintain commodity and energy exposure while inflation momentum persists.
- Keep gold exposure as a hedge against inflation and policy credibility risk.
- Be cautious on long-duration bonds if CPI continues toward 5%.
- Avoid chasing US large-cap tech after major inflows and extreme breadth/concentration signals.
- Watch Bull & Bear Indicator for a move to 8.0 as a tactical sell signal.
- Monitor 10Y UST near 5%; a breakout could challenge equity multiples.
- Watch for political headlines around inflation, affordability, tariffs, and energy.
This is an inflationary melt-up. Stocks and commodities are being bid because investors believe the Fed will not hike even as CPI accelerates. That supports risk assets in the short run, but it pushes the burden of tightening onto the bond market.
The rally can continue into late May or early June, especially if flows keep chasing US large-cap tech and commodities. But the setup is increasingly fragile: semiconductors are historically stretched, private clients are at record equity allocations, cash is at record lows, and the Bull & Bear Indicator is close to a sell signal.
The right answer is not to fight the melt-up too early. But it is time to start taking profits into strength, especially in crowded chips, tech, and commodity winners, while keeping hedges for a bond-yield or inflation shock.
Disclaimer: The material provided is for information purposes only and should not be considered as investment advice. The views, information, or opinions expressed in the text belong solely to the author, and not to the author’s employer, organization, committee or other group or individual or company.
Past performance is not indicative of future results.
High Risk Warning: CFDs are complex instruments and come with a high risk of losing money rapidly due to leverage. 71% and 74% of retail investor accounts lose money when trading CFDs with Tickmill UK Ltd and Tickmill Europe Ltd respectively. You should consider whether you understand how CFDs work and whether you can afford to take the high risk of losing your money.
Futures and Options: Trading futures and options on margin carries a high degree of risk and may result in losses exceeding your initial investment. These products are not suitable for all investors. Ensure you fully understand the risks and take appropriate care to manage your risk.
Patrick has been involved in the financial markets for well over a decade as a self-educated professional trader and money manager. Flitting between the roles of market commentator, analyst and mentor, Patrick has improved the technical skills and psychological stance of literally hundreds of traders – coaching them to become savvy market operators!